

Managing spare parts inventory requires balancing stock levels to avoid tying up too much capital or risking production downtime. Inventory turnover is the key metric to evaluate how efficiently your stock is being used.
Here’s a quick breakdown of what you need to know:
- Formula: Inventory Turnover = Total Value of Parts Issued ÷ Average Inventory Value.
-
Optimal Range: Depends on your industry. For example:
- Automotive: 7.5+
- Oil & Gas: 1.0–2.5
- General industrial plants: 3.0–5.0
- Critical Nuance: High turnover isn’t always good. For spare parts, especially critical ones (like custom gearboxes), availability matters more than usage.
-
Data Needed:
- Total value of parts issued (from CMMS).
- Average inventory value (from ERP/WMS).
- Full landed costs (including shipping and taxes).
-
Poland-Specific Standards:
- Currency: PLN
- Date: DD.MM.YYYY
- Decimal separator: Comma (,)
- Thousands separator: Space (e.g., 1 000,00 PLN)
Key Tip: Separate consumables (e.g., bearings, filters) from "insurance spares" (e.g., expensive, rarely used items). This avoids skewing your turnover ratio and ensures better inventory decisions.
By regularly calculating and analyzing turnover, you can cut carrying costs (20–30% of inventory value annually) and avoid stockouts that could halt operations. For example, improving a turnover ratio from 1.0 to 2.0 on a 5,000,000 PLN inventory could save 625,000 PLN per year.
Next Steps:
- Collect accurate data from your systems (ERP, CMMS, WMS).
- Use a 13-month rolling average for better accuracy.
- Exclude rarely used capital spares from calculations.
- Regularly audit for slow-moving or obsolete stock.
This approach ensures a leaner, more efficient inventory while maintaining the availability of critical parts.
Preparing Data for Spare Parts Turnover Calculations
What Data You Need for Turnover Calculations
To calculate spare parts turnover, you’ll need two main data points: the total value of parts issued (everything taken from the storeroom and charged to work orders over a 12-month period) and the average inventory value, which is the mean stock value held during the same timeframe.
For accuracy, it’s crucial to use the full landed cost - this includes shipping and taxes. Ignoring these costs can lead to an understated inventory value and an inflated turnover ratio. Additionally, ensure each part is labeled with its category and criticality level. This allows you to separate consumables from insurance spares, which is essential for interpreting the results accurately.
| Data Point | System Source | Purpose in Calculation |
|---|---|---|
| Beginning/Ending Value | ERP / WMS Inventory Module | Calculates average inventory value (denominator) |
| Parts Issued Value | CMMS Work Order History | Represents total maintenance material cost (numerator) |
| Unit Cost (Landed) | ERP Purchasing / Finance | Ensures valuation includes shipping and taxes |
| Part Category/Criticality | CMMS Part Master Record | Enables segmented analysis (Operational vs. Capital) |
| Asset Association | CMMS Asset Hierarchy | Identifies obsolete parts linked to retired equipment |
Once you've gathered the data, the next step is to extract it efficiently from your industrial systems.
How to Extract Data from Industrial Systems
The data you need is typically stored across three systems: CMMS (Computerised Maintenance Management System) for work order and parts usage history, ERP (Enterprise Resource Planning) for financial and procurement records, and WMS (Warehouse Management System) for stock levels.
Accurate data extraction is critical because it directly impacts the reliability of your turnover calculations and, ultimately, your inventory strategy. As Tim Cheung, CTO and Co-Founder of Factory AI, explains:
"The core question isn't just 'how do I calculate this?' It is: 'How do I balance the cost of holding inventory against the catastrophic cost of equipment downtime?'"
One common issue is the "squirrel stash" problem - when technicians pull parts from the storeroom but don’t use them immediately. In such cases, the CMMS may record the part as issued, inflating your numerator, even though the part remains unused on-site. To avoid this, use mobile CMMS tools with barcode or QR scanning to ensure parts are only recorded as issued when they’re actually consumed.
Once your extraction process is complete, you can calculate a precise average inventory value, which forms the foundation for turnover analysis.
How to Calculate Average Inventory
The formula for calculating average inventory value is simple:
Average Inventory Value = (Beginning Inventory Value + Ending Inventory Value) ÷ 2
However, relying on a single year-end snapshot can be misleading, especially for facilities with seasonal maintenance cycles or scheduled shutdowns. These events often lead to significant stock-ups, which can distort the average. To address this, many organisations use a 13-month rolling average. This method involves summing the 12 month-end values plus the beginning value of the first month, then dividing by 13.
"If you only calculate this [Average Inventory Value] once a year, your ratio will be wildly inaccurate. Leading organisations now use inventory management modules within their CMMS to calculate this on a rolling monthly or even weekly basis." - Tim Cheung, CTO and Co-Founder, Factory AI
Lastly, stick to a single valuation method - either FIFO (First-In, First-Out) or Weighted Average Cost - for the entire calculation period. Mixing methods as prices fluctuate can skew your results and make year-over-year comparisons unreliable.
sbb-itb-52f18a4
The Stock Turn Illusion
How to Calculate Spare Parts Inventory Turnover
Spare Parts Inventory Turnover: Industry Benchmarks & Category Targets
Key Formulas for Spare Parts Turnover
Calculating turnover for spare parts differs from retail methods. Instead of using Cost of Goods Sold (COGS), substitute it with the total value of parts issued, which represents the actual consumption recorded on work orders:
Spare Parts Turnover = Total Value of Parts Issued ÷ Average Inventory Value
This formula works for most industrial facilities. However, if you're dealing with on-site consumption, like maintenance teams servicing multiple locations, use this adjusted formula:
POU Turnover = Annual Inventory Usage ÷ (Average Inventory On Hand − Safety Stock)
Step-by-Step Calculation Process
- Define the period. Use a full 12-month timeframe. Shorter periods can skew the results and make benchmarking less reliable.
- Gather the total value of parts issued. Extract this data (using landed cost) from your CMMS work order history.
-
Determine the average inventory value. A 13-month rolling average is ideal. If unavailable, calculate it as:
(Beginning Inventory Value + Ending Inventory Value) ÷ 2. - Exclude capital spares. Remove expensive, rarely used items like insurance spares from your calculation. For instance, a turbine rotor worth 1,100,000 PLN sitting unused for years can distort the turnover ratio for fast-moving items.
- Calculate and document. Apply the appropriate formula, then record the result along with details like the period, valuation method, and any exclusions. This ensures consistency for year-over-year comparisons.
Once you’ve calculated the turnover, interpret the results in line with your inventory strategy.
How to Read Your Turnover Results
The turnover ratio's meaning depends on the spare parts category - context is everything.
"A turnover ratio of 1.0 to 3.0 is healthy for general MRO supplies. However, for critical insurance spares, a ratio of 0.5 or lower is acceptable, provided the risk of stockout is managed." - Tim Cheung, CTO and Co-Founder, Factory AI
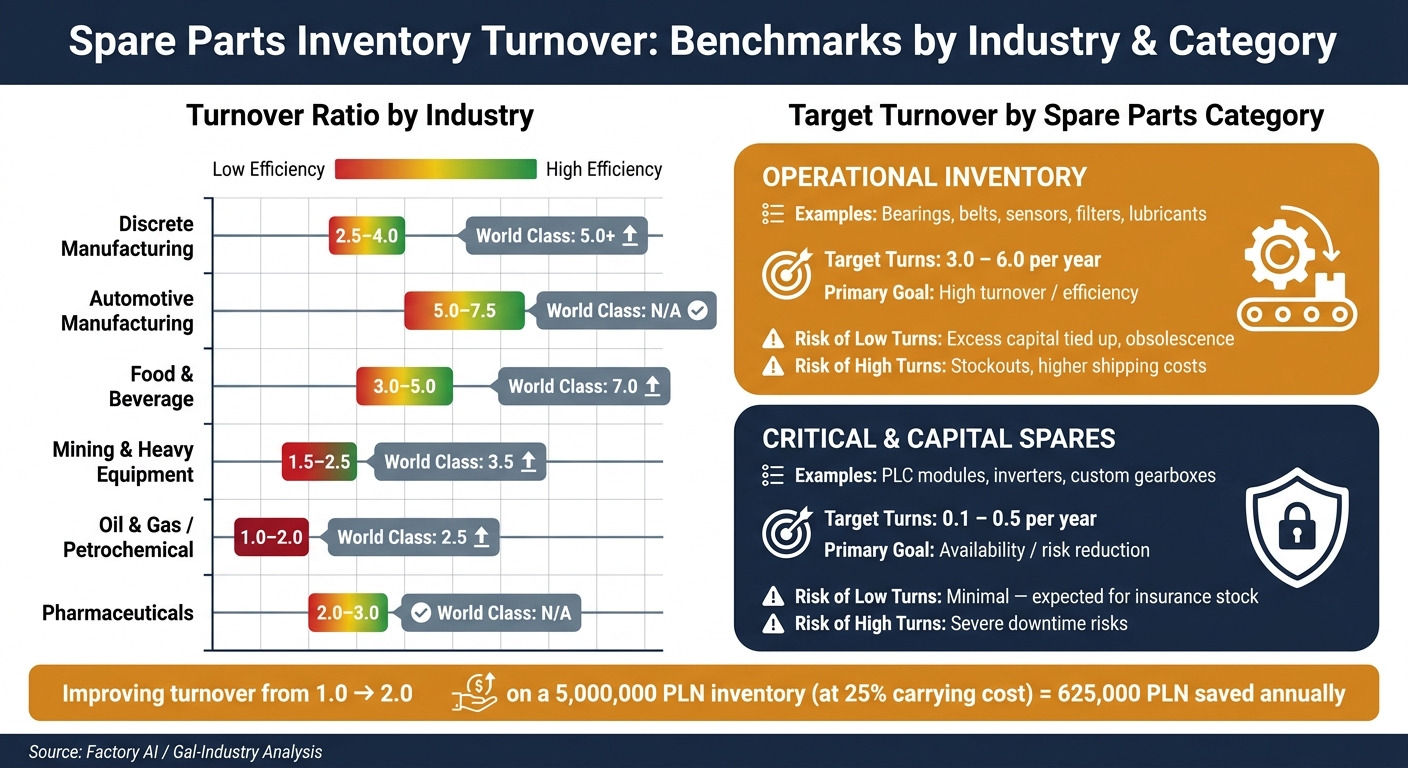
For most facilities, the ideal range is between 3.0 and 5.0. A ratio below 1.0 suggests too much money is tied up in slow-moving stock, while values above 8.0 in heavy industries could signal a risky, hand-to-mouth operation prone to stockouts.
Here’s a breakdown of typical benchmarks by industry:
| Industry Segment | Typical Turnover Ratio | "World Class" Target |
|---|---|---|
| Discrete Manufacturing | 2.5 – 4.0 | 5.0+ |
| Automotive Manufacturing | 5.0 – 7.5 | N/A |
| Food & Beverage | 3.0 – 5.0 | 7.0 |
| Mining & Heavy Equipment | 1.5 – 2.5 | 3.5 |
| Oil & Gas / Petrochemical | 1.0 – 2.0 | 2.5 |
| Pharmaceuticals | 2.0 – 3.0 | N/A |
For example, improving a turnover ratio from 1.0 to 2.0 on a 5,000,000 PLN inventory - assuming annual carrying costs of 25% - could save around 625,000 PLN annually. That’s money you can redirect to planned maintenance or equipment upgrades.
"In a retail environment, a high inventory turnover ratio is almost always a sign of success. In an industrial maintenance, repair, and operations (MRO) environment, a high turnover ratio can actually be a warning sign of impending failure." - Tim Cheung, CTO and Co-Founder, Factory AI
Calculating Turnover by Spare Parts Category
Breaking down your spare parts into specific categories helps set clearer turnover goals and refine your inventory strategy. Treating all spare parts the same can lead to skewed expectations, so it’s essential to evaluate each category independently.
Operational Inventory
Operational inventory includes high-usage consumables like bearings, belts, sensors, filters, and lubricants - items that maintenance teams rely on frequently. The recommended turnover rate for this category is between 3.0 and 6.0 turns per year.
Running out of these parts can be costly. In fast-paced production settings, a stockout of something as basic as a bearing or sensor can result in losses exceeding 10,000 PLN per hour due to halted operations.
"In a manufacturing plant, if a conveyor motor turns over every 3 days, you have a catastrophic reliability problem." - Factory AI
Keep an eye on emergency purchase costs alongside turnover rates. If both are climbing, it could signal that your stock levels are being cut too deeply rather than being optimised.
Critical and Capital Spares
Critical and capital spares fall into a different category altogether. These are high-cost, low-usage items like PLC modules, inverters, and custom gearboxes, which act as a safety net against major production downtime. For these, availability takes precedence over turnover.
"Capital spares... are insurance policies, not 'inventory' in the traditional sense. Their turnover ratio is irrelevant; their availability is everything." - Factory AI
A turnover ratio between 0.1 and 0.5 is typical for these parts. For instance, holding a 50,000 PLN inverter might lead to annual carrying costs of 10,000–15,000 PLN (assuming a 20–30% carrying rate). However, these costs pale in comparison to the potential losses caused by unplanned downtime. For critical spares, focus on the availability rate as your key performance metric. This approach aligns better with risk management and inventory optimisation.
Table: Operational Inventory vs. Critical & Capital Spares
| Feature | Operational Inventory | Critical & Capital Spares |
|---|---|---|
| Examples | Bearings, belts, sensors, filters | PLC modules, inverters, custom gearboxes |
| Primary Goal | High turnover / efficiency | Availability / risk reduction |
| Target Turns | 3.0 – 6.0 | < 1.0 (typically 0.1 – 0.5) |
| Risk of Low Turns | Excess capital tied up, obsolescence risk | Minimal - expected for "insurance" stock |
| Risk of High Turns | Stockouts, higher shipping costs | Severe downtime risks |
Spotting Slow-Moving and Obsolete Parts
Once your inventory is categorised, it’s easier to identify slow-moving and obsolete parts (SLOB). These are items with little to no movement or no future use. A common benchmark is parts with zero turnover in the past 12 to 24 months.
To measure the impact, use this formula:
(Value of Slow-Moving Parts ÷ Total Inventory Value) × 100. For instance, if 10% of a 2,000,000 PLN inventory qualifies as SLOB, that’s 200,000 PLN tied up, generating roughly 60,000 PLN in annual carrying costs.
"If you have $100,000 of 'dead stock' (parts that haven't moved in 2 years), you are effectively burning $25,000 annually just to keep them on the shelf." - Tim Cheung, CTO and Co-Founder, Factory AI
SLOB issues often arise from equipment upgrades or phase-outs that leave behind incompatible parts. Once identified, you can explore options like internal redeployment, write-offs, or resale. For outdated industrial automation components - such as older Siemens or Allen-Bradley modules - specialised platforms like Gal-Industry offer a way to recoup some of your investment by buying back surplus and obsolete inventory.
Tools and Automation for Turnover Analysis
Manual and Automated Analysis Tools
After ensuring accurate data collection and calculations, the next step is selecting the right tools to consistently track turnover. This isn't a task you do once and forget - it requires ongoing monitoring.
For smaller operations, Excel can be a good starting point. It allows for straightforward turnover calculations, but keep in mind that manual updates limit its ability to provide real-time insights. For businesses with more complex inventory systems, ERP platforms like SAP, Odoo, or NetSuite are far more effective. These systems use actual stock transaction logs to generate turnover statistics automatically, comparing "Actual" versus "Calculated" turnover ratios while eliminating the need for manual data entry. To go a step further, linking your ERP to business intelligence tools like Power BI enables you to create interactive dashboards. These dashboards can reveal turnover trends, highlight slow-moving inventory, and even flag obsolete items in real time.
Some advanced CMMS platforms with AI capabilities take it even further. They can instantly update turnover ratios when parts are scanned and even initiate automatic purchase orders based on predicted failure rates. This process, often referred to as prescriptive procurement, helps businesses stay ahead of potential shortages.
"True efficiency is a high turnover of parts used for planned maintenance, not emergency repairs." - Tim Cheung, CTO and Co-Founder, Factory AI
However, automation is only as good as the data feeding it. If your CMMS contains outdated pricing or parts aren’t linked to the correct assets, even the most advanced tools will produce unreliable results. Clean, organized data is the backbone of effective turnover analysis and reporting.
How to Organise Turnover Data
A turnover ratio by itself doesn’t reveal much. The real insights come from how you structure and interpret the data. Organizing reports by key categories - like location (specific warehouses or facilities), brand (e.g., Siemens, ABB, Allen-Bradley), or component type (bearings, sensors, inverters) - can help pinpoint inefficiencies more effectively.
For instance, a facility-wide turnover ratio might look fine on the surface. But when you break it down by category, you might find that operational consumables are turning over quickly, while legacy PLC modules sit unsold for months. Separating capital spares from operational inventory is also critical. Including high-value insurance parts in your overall turnover calculations can artificially lower the ratio, leading to poor decision-making.
How Gal-Industry Can Support Your Inventory Strategy
Once your reports identify inefficiencies, targeted solutions become crucial. This is where Gal-Industry can make a difference in managing surplus inventory and sourcing hard-to-find parts.
If your turnover analysis highlights outdated or slow-moving inventory - such as older Siemens PLCs, discontinued Allen-Bradley modules, or surplus ABB inverters - Gal-Industry’s buyback service can help. By purchasing these items, they free up capital tied to stagnant inventory and improve your overall turnover metrics.
On the other hand, if turnover analysis reveals understocked critical spares, Gal-Industry’s global sourcing network can locate rare or discontinued components quickly. This ensures you can fill inventory gaps without risking overstocking, keeping your operations running smoothly while maintaining optimal inventory levels.
Conclusion and Key Takeaways
Spare parts inventory turnover is more than just a number - it’s a powerful tool for maintenance managers to evaluate how effectively their storeroom supports the business. With carrying costs often reaching 20–30% of inventory value annually, every unused part represents money tied up unnecessarily.
The real insight lies in understanding the context behind the turnover ratio. As Tim Cheung points out, the key is finding the right balance between holding costs and the risk of downtime. For instance, a turnover ratio of 1.5 might make perfect sense for a critical spare like a custom gearbox but could signal inefficiency for a standard consumable. Accurate data and proper categorisation are crucial to making these distinctions meaningful.
Separating operational consumables from capital spares is essential because mixing these categories can distort the ratio. Additionally, ensuring precise landed costs (factoring in purchase price, shipping, and taxes) and maintaining clean CMMS records are critical steps for reliable analysis. This clarity allows you to implement focused strategies to cut carrying costs while avoiding operational disruptions.
This guide has outlined the calculations and strategies needed to optimise inventory management. For example, improving turnover from 1.0 to 2.0 on a 5,000,000 PLN inventory could result in annual savings of approximately 625,000 PLN. Regular SLOB audits and smart ABC/VED analysis can turn a low turnover ratio into substantial financial benefits year after year.
FAQs
How do I stop critical spares from distorting turnover?
To prevent critical spares from skewing inventory turnover metrics, handle them separately and leave them out of standard calculations. Keep critical spares distinct from regular inventory, monitor their usage independently, and set specific turnover goals tailored to these items. Instead of traditional turnover rates, prioritize KPIs such as availability and stockout frequency for critical spares. This ensures reliability while maintaining a clear view of overall inventory performance.
What’s the best way to handle “issued but not used” parts in CMMS?
To manage "issued but not used" parts in a CMMS, it's essential to keep a close eye on inventory and make adjustments to stock levels to prevent overstocking. One effective metric to track is the inventory turnover ratio (calculated as the value of issued parts ÷ average inventory). This can help pinpoint inefficiencies in inventory management.
For parts with low turnover, assess whether they are obsolete or simply overstocked. Additionally, leverage your CMMS to flag parts that remain unused over a certain period. This will help fine-tune inventory levels and reduce the risk of accumulating dead stock.
Should I use FIFO or weighted average cost for turnover?
When deciding between FIFO (First-In, First-Out) and the weighted average cost method, it all comes down to your accounting strategy and the nature of your inventory.
FIFO works well for products with a short shelf life or when prices are climbing. This method ensures that your COGS (Cost of Goods Sold) reflects the most recent costs, which can be crucial for accurate financial reporting in such scenarios.
On the other hand, the weighted average cost method spreads out price changes by averaging the costs of all inventory items. This creates a more stable valuation, which can be helpful if your inventory prices fluctuate frequently.
Both approaches are effective for calculating inventory turnover, so the choice ultimately depends on what fits your stock management system best.